Here's how to get a tax extension from the IRS in 2024
If you're one of the millions of taxpayers who delay their taxes, it's easy to get an extension to October 15.
Watch CBS News
If you're one of the millions of taxpayers who delay their taxes, it's easy to get an extension to October 15.

The former president's media company has had a rough welcome on Wall Street, shedding two-thirds of its value since its peak.

The tax-prep software giant says it has resolved an issue that blocked some customers from e-filing on Sunday and much of Monday.

"It must be done," Tesla CEO Elon Musk said in a memo about the layoffs sent to employees on Sunday.

The housing market continues to be challenging for both buyers and sellers this year, as mortgage rates and asking prices continue to climb
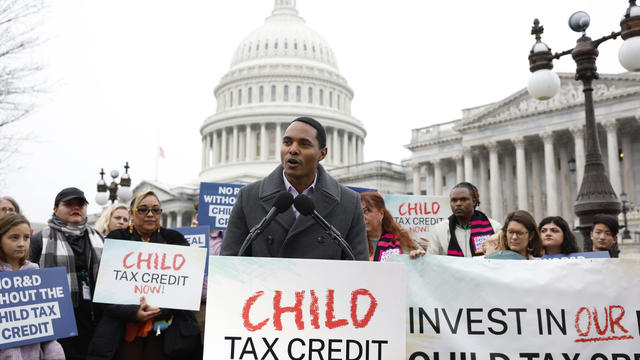
After passing easily in the House, a bill that would have expanded the CTC is stalled in the Senate. Here's what to know.

Dream condiment now a reality: Heinz Classic Barbiecue Sauce available in the U.K. and Spain. Will "Kenchup" be next?
Nike's unitard for female track and field athletes representing the U.S. at the 2024 Paris Olympics is too revealing, critics say.
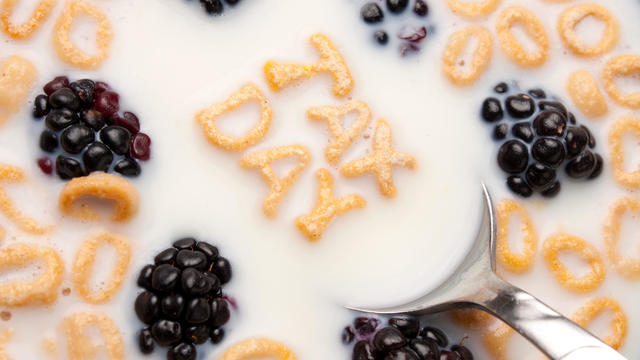
As Americans race to file their returns on Tax DAy, restaurant chains and other businesses are offering a range of deals.
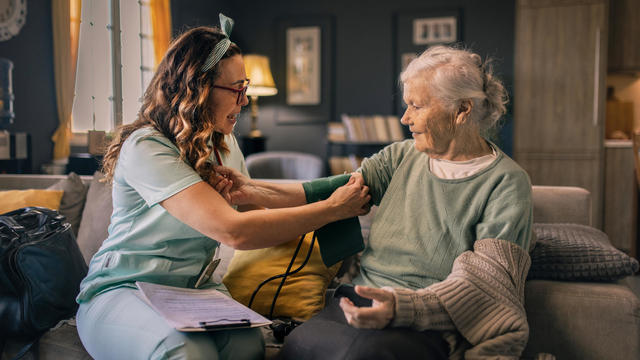
Long-term care insurance premiums increase as you age. Here's when those may still be worth it.

A reverse mortgage can help relieve financial pressure for seniors, but it's important to get the timing right.

Gold bars and coins could be worth pursuing now that inflation is on the rise again.
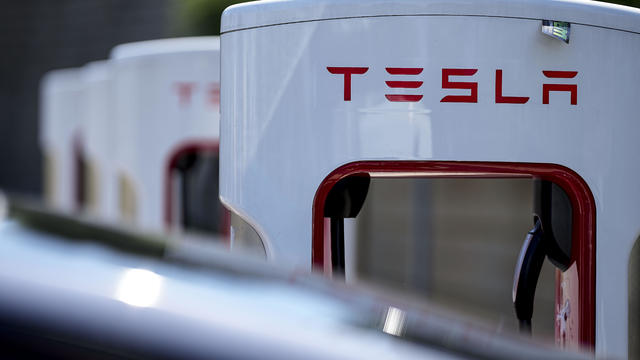
Tesla accounted for 80% of electric vehicle sales in the U.S. in 2020, but that figure fell to 55% last year.
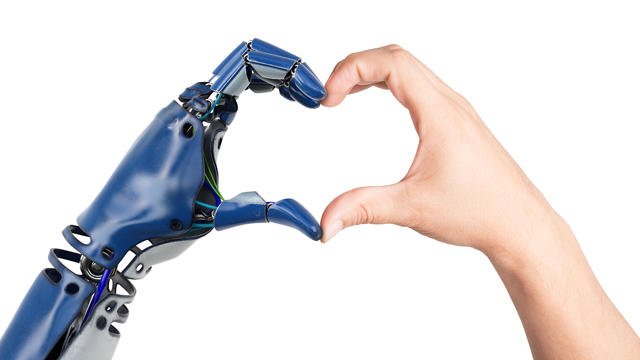
The generative artificial intelligence boom has led to the emergence of romantic companion bots.

Apple said it will stop selling the devices later this month in order to comply with a U.S. import ban.
Alex Jones, the conspiracy theorist known for his fake news site InfoWars and his false denial of the Sandy Hook massacre, was permanently banned from Twitter in 2018.
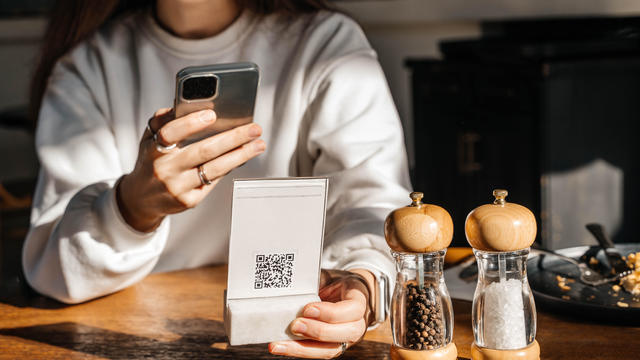
More than 90 million consumers will scan a QR code this year. But the technology can also facilitate identity theft.
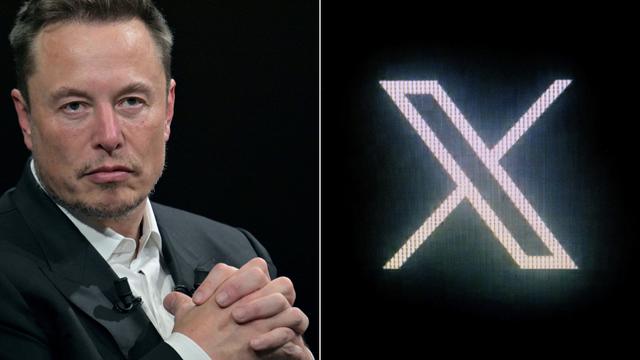
The billionaire owner of X took a defensive tone, saying that "the whole world will know that those advertisers killed the company."
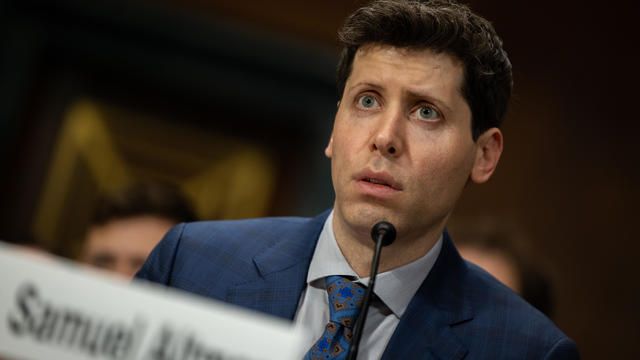
OpenAI co-founder Sam Altman says he's looking forward to returning to the company, with the support of Microsoft's CEO, to build the 2 companies' "strong partnership."

Musk, who is under fire for supporting an antisemitic post, said the money will be donated to hospitals in Israel and to the Red Cross in Gaza.
Altman landed at Microsoft, the biggest investor in OpenAI, as former Twitch leader Emmett Shear was named OpenAI's new chief executive.

The Supreme Court is hearing arguments in a case challenging the scope of a federal obstruction statute that federal prosecutors have used to charge more than 300 Jan. 6 defendants.
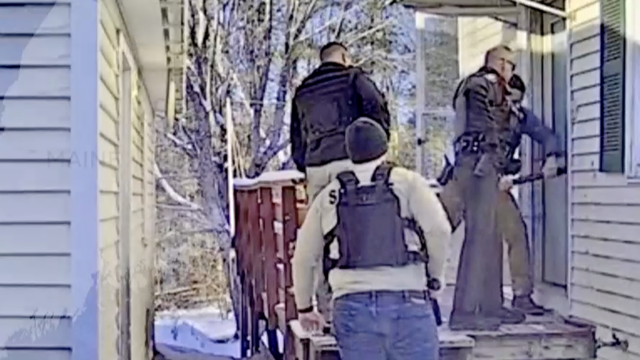
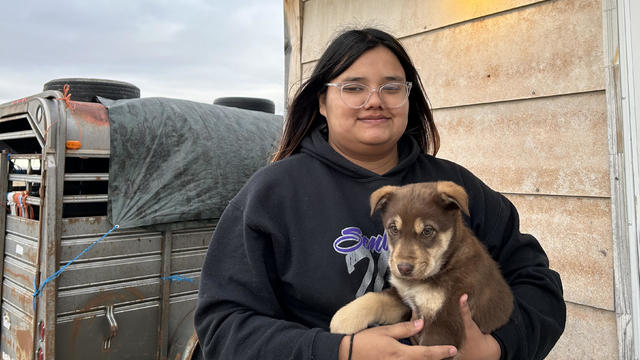
Maine is the newest frontier for the illicit marijuana trade, with potentially hundreds of suspected unlicensed grow houses operating in the state.

Jury selection in former President Donald Trump's historic criminal trial in New York is continuing for a second day on Tuesday.

A fourth body was recovered Sunday at the site of the Key Bridge collapse, according to the Unified Command.

The House speaker says he wants to put up separate individual bills on aid for Ukraine, Israel, and Taiwan.

The union for American Airlines pilots says it's been seeing "a significant spike in safety- and maintenance-related problems in our operation."

The 17th-century building's iconic spire, thought to protect the building "against enemy attacks and fires," collapsed among the flames.
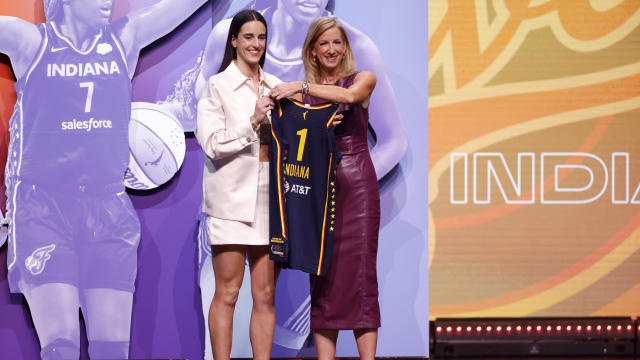
"I dreamed of this moment since I was in second grade," Clark said.

Bella Hadid raised eyebrows after sharing her elaborate morning routine on TikTok, and other over-the-top celebrity self-care rituals are everywhere. Here's what experts suggest you aim for instead.
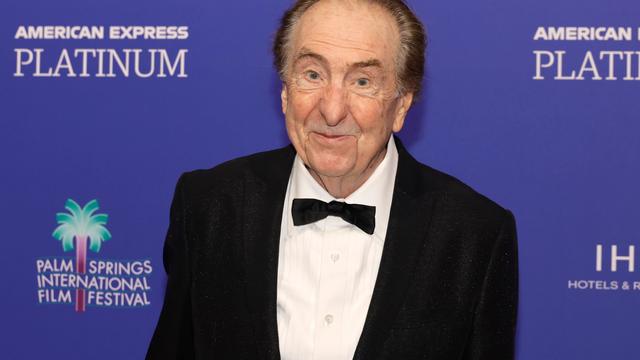
Former "Monty Python" star Eric Idle said people "always assume we're loaded." He added, "I have to work for my living."
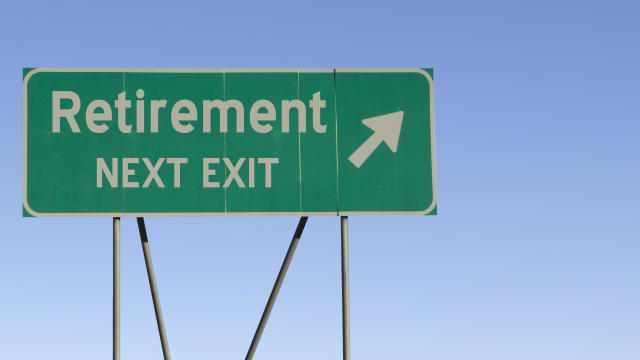
Only about 1 in 10 Americans understands the basics of longevity, or how long they'll live in retirement. Can you pass the test?

Over the next few years, the U.S. could see a surge in seniors living in poverty, one retirement expert predicts.

The gap between what people think they'll need for old age and their actual savings is massive, even for those nearing retirement.

Seniors and other recipients of the Social Security program may get a cost-of-living adjustment of 3.1% next year, one forecast says.
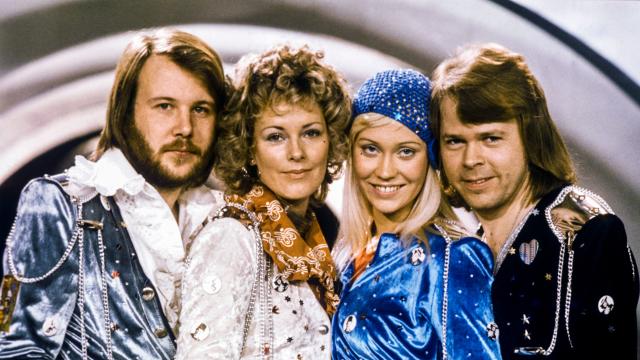
ABBA, Blondie and The Notorious B.I.G. are entering America's audio canon.
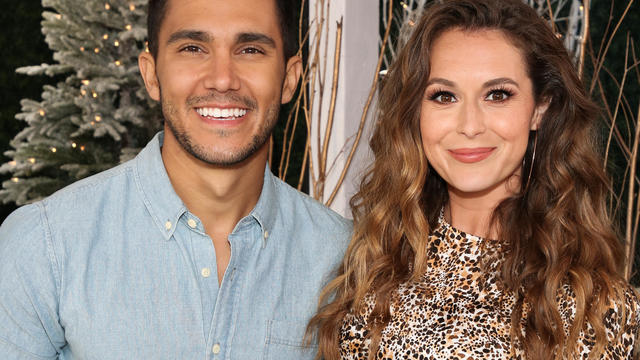
"Grief has come to us in waves. Moments of feeling absolutely gutted... then moments of feeling blessed by just getting a moment with her," the couple said.
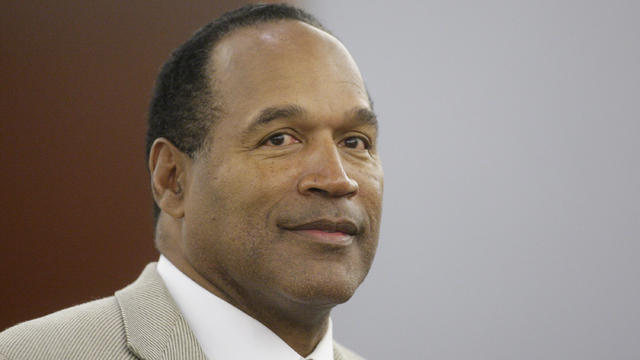
O.J. Simpson's former attorney and the current executor of his estate previously said he hoped the Goldman family would get "zero, nothing."
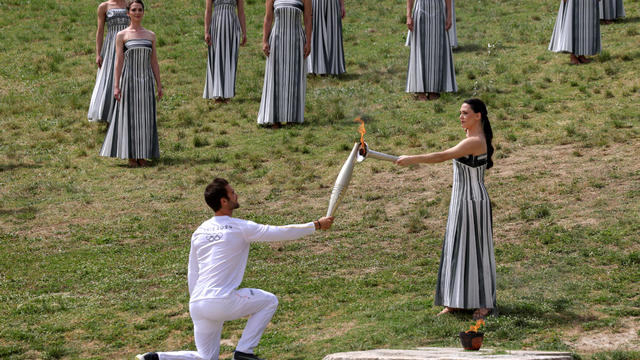
A whopping 10,000 athletes will cary the torch 3,100 miles over 68 days.
The Supreme Court is hearing arguments in a case challenging the scope of a federal obstruction statute that federal prosecutors have used to charge more than 300 Jan. 6 defendants.
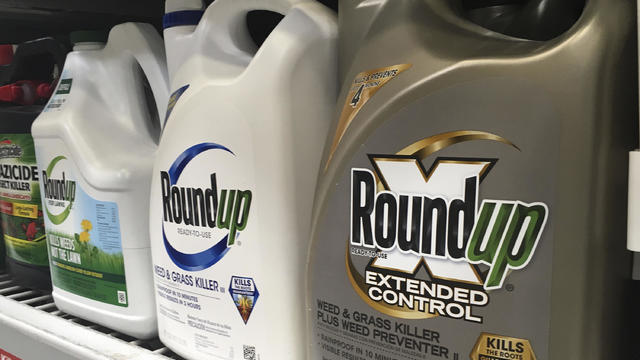
Bayer has been lobbying lawmakers in three states to pass bills providing it legal protection from suits claiming Roundup causes cancer. Experts say such a measure could have much broader implications.
The union for American Airlines pilots says it's been seeing "a significant spike in safety- and maintenance-related problems in our operation."
The housing market continues to be challenging for both buyers and sellers this year, as mortgage rates and asking prices continue to climb
The tax-prep software giant says it has resolved an issue that blocked some customers from e-filing on Sunday and much of Monday.
Nike's unitard for female track and field athletes representing the U.S. at the 2024 Paris Olympics is too revealing, critics say.
The Supreme Court is hearing arguments in a case challenging the scope of a federal obstruction statute that federal prosecutors have used to charge more than 300 Jan. 6 defendants.
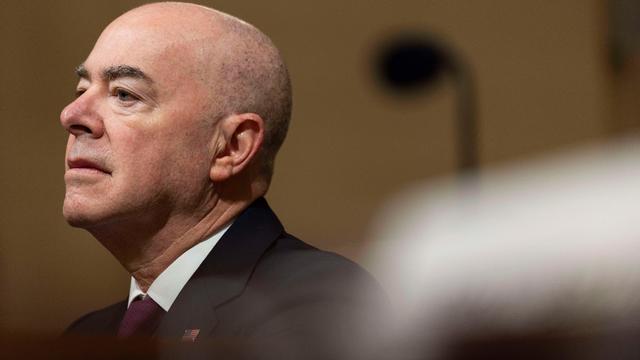
The Senate is tasked with the trial after the House impeached Mayorkas earlier this year. Senate Democrats are expected to move to quickly quash the effort.
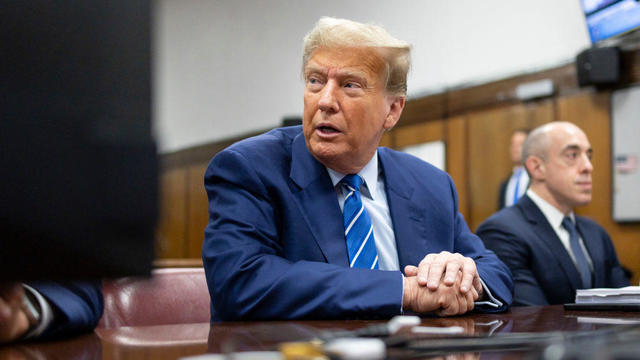
Jury selection in former President Donald Trump's historic criminal trial in New York is continuing for a second day on Tuesday.
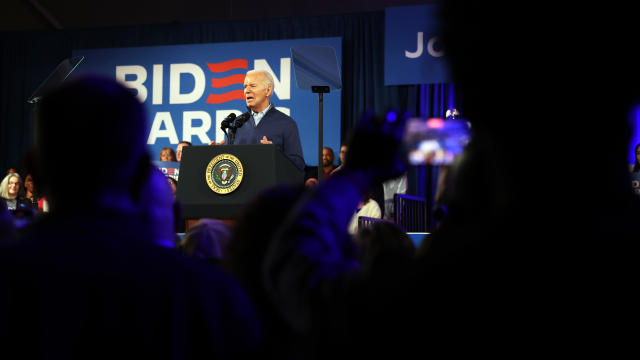
President Biden believes painting former President Trump as a "threat" to democracy is a crucial contrast to highlight in his campaign.
The House speaker says he wants to put up separate individual bills on aid for Ukraine, Israel, and Taiwan.
"Grief has come to us in waves. Moments of feeling absolutely gutted... then moments of feeling blessed by just getting a moment with her," the couple said.
Bella Hadid raised eyebrows after sharing her elaborate morning routine on TikTok, and other over-the-top celebrity self-care rituals are everywhere. Here's what experts suggest you aim for instead.
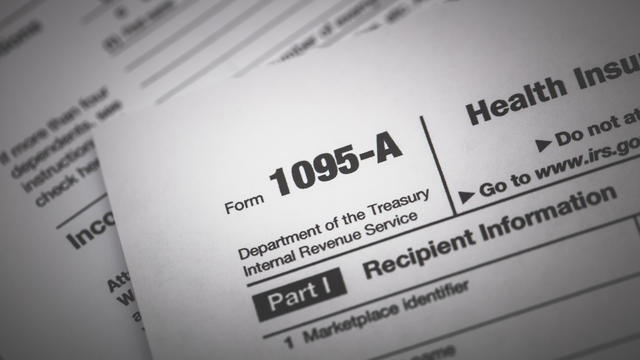
Consumer complaints have risen in recent months of unauthorized enrollment in Affordable Care Act coverage.
Social services, such as parenting classes and economic development programs, can help, some health experts say. But insurers don't always cover these services.
George Schappell and sister Lori, of Reading, Pa., were the world's oldest conjoined twins, according to the Guinness Book of World Records.
A whopping 10,000 athletes will cary the torch 3,100 miles over 68 days.
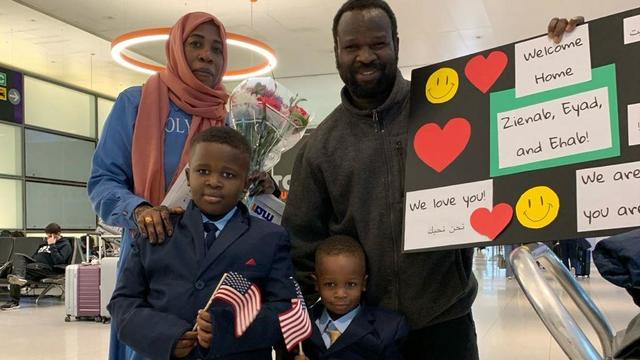
A Sudanese-American family is the first to be reunited in the U.S. after a woman and her sons spent nearly a year stuck in Saudi Arabia.
The 17th-century building's iconic spire, thought to protect the building "against enemy attacks and fires," collapsed among the flames.
The House speaker says he wants to put up separate individual bills on aid for Ukraine, Israel, and Taiwan.

Iran's attack on Israel has renewed urgency in getting a Senate-passed bill through the House. But the bill also threatens Johnson's speakership.
ABBA, Blondie and The Notorious B.I.G. are entering America's audio canon.
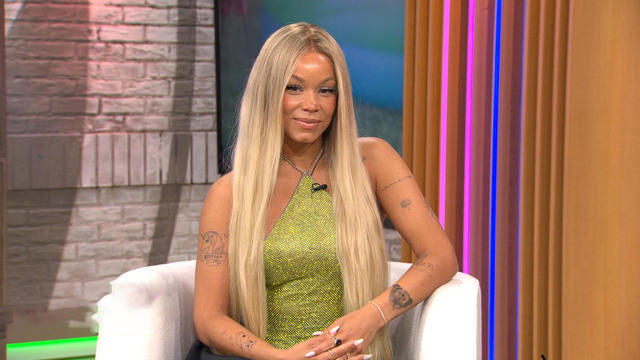
Recognized as one of CMT's "Next Women of Country," Tanner Adell's career soared after her appearances on Beyoncé's latest album. With a 1,500% spike in Spotify listeners and a new single, "Whiskey Blues," Adell is quickly becoming a standout in the country-pop scene.
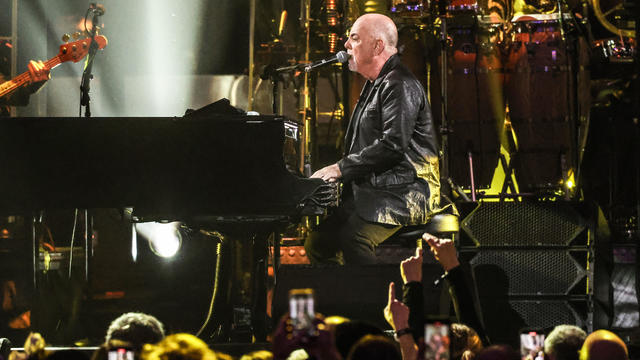
A Billy Joel special on CBS and Paramount+ will air again after it was cut off in the middle of the singer's performance of "Piano Man."
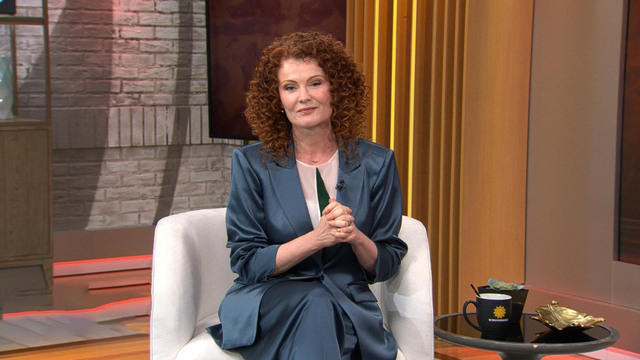
This week on CBS’s hit comedy "Ghosts," Rebecca Wisocky returns as the Gilded Age socialite Hetty, revealing surprising details about her character's past.
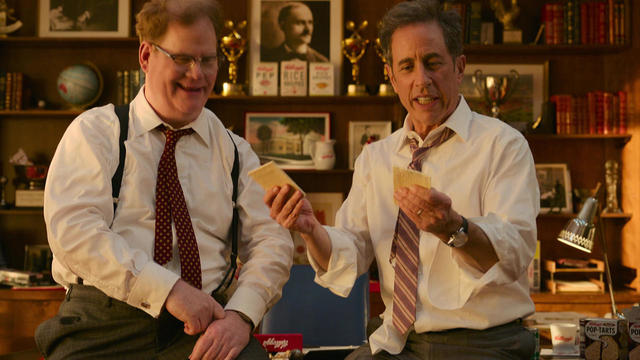
The comedian has stepped into his director's shoes for his new film, the not-quite-true story of the creation of the Kellogg's Pop-Tart.

The Biden administration is awarding Samsung $6.4 billion to expand American chipmaking. The company will spread the money across at least five facilities in Texas. Sujai Shivakumar, senior fellow at the Center for Strategic and International Studies, joins CBS News to assess the economic and technological impacts.

Roku said Friday a second security breach impacted more than 576,000 accounts after announcing in March that 15,000 accounts had been exposed by a hack. Emma Roth, a writer for The Verge, joins CBS News with more details.

From labor shortages to environmental impacts, farmers are looking to AI to help revolutionize the agriculture industry. One California startup, Farm-ng, is tapping into the power of AI and robotics to perform a wide range of tasks, including seeding, weeding and harvesting.

The bill reforms and extends a portion of the Foreign Intelligence Surveillance Act known as Section 702 for a shortened period of two years.

The feature will be turned on by default globally for teens under 18. Adult users will get a notification encouraging them to activate it, Meta said.

NASA said it agrees with an independent review board that concluded the project could cost up to $11 billion without major changes.
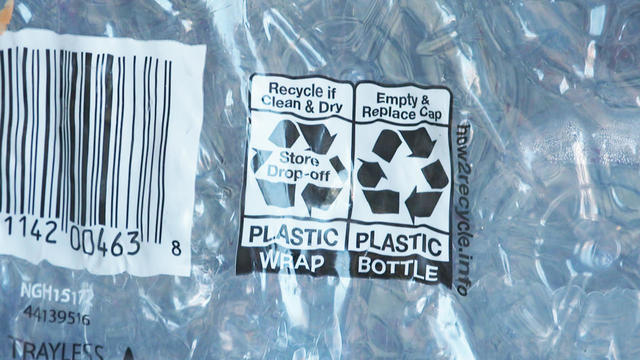
Only 5 to 6% of plastic waste produced in the U.S. is actually recycled. A new report accuses the plastics industry of a decades-long campaign to "mislead" the public about the viability of recycling.

Mexico City, one of the world's most populated cities with nearly 22 million people, could run out of water in months. Florencia Gonzalez Guerra, an investigative video journalist, joins CBS News to examine the causes behind the crisis.

Greenhouse gas emissions continued increasing in 2023, according to new data from the National Oceanic and Atmospheric Administration. CBS News' Elaine Quijano breaks down the numbers and what they mean for the climate.
The Biden administration awarded $830 million Thursday to fund projects that will address the impact of climate change on America's aging infrastructure. Ali Zaidi, an assistant to the president and national climate adviser, joins CBS News with more on the funding.
Jury selection in former President Donald Trump's historic criminal trial in New York is continuing for a second day on Tuesday.
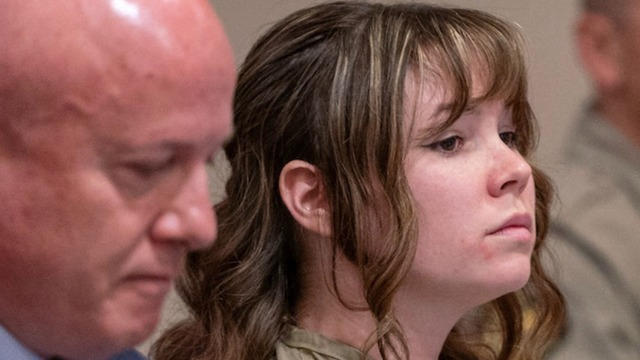
Hannah Gutierrez-Reed, the "Rust" Western film armorer who last month was found guilty of involuntary manslaughter in the deadly shooting of the film's cinematographer Halyna Hutchins, was sentenced to 18 months in prison for her part in the 2021 incident. CBS News legal contributor Jessica Levinson breaks down the sentencing.
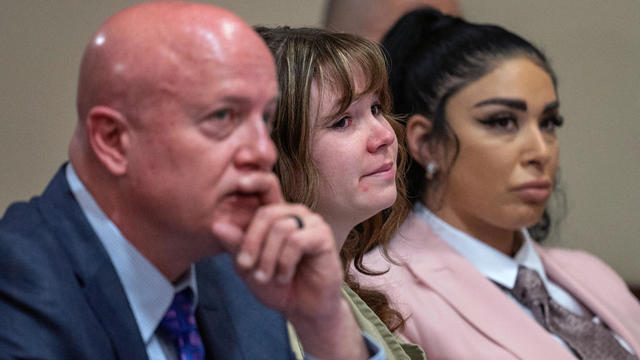
Hannah Gutierrez-Reed, the armorer on Alec Baldwin's film "Rust," was given the maximum sentence of 18 months in prison for involuntary manslaughter.

A teenager has been arrested after a stabbing attack in a church in a Sydney suburb that officials Monday called "a terrorist incident."
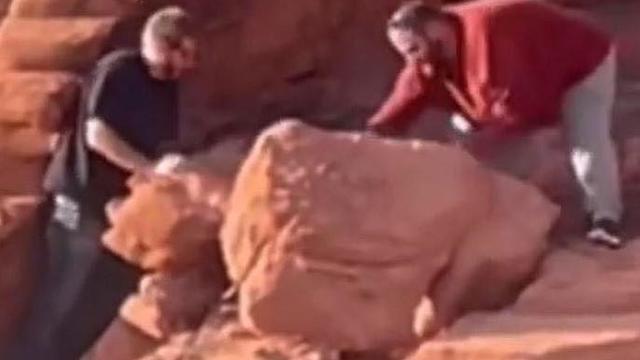
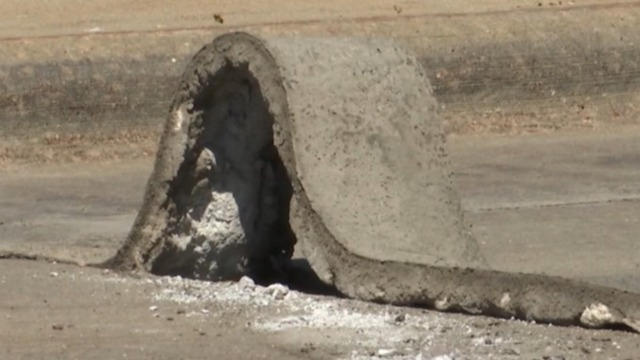
Federal authorities are asking for the public's help in tracking down two men seen damaging popular rock formations at the Lake Mead National Recreation Area in Nevada.
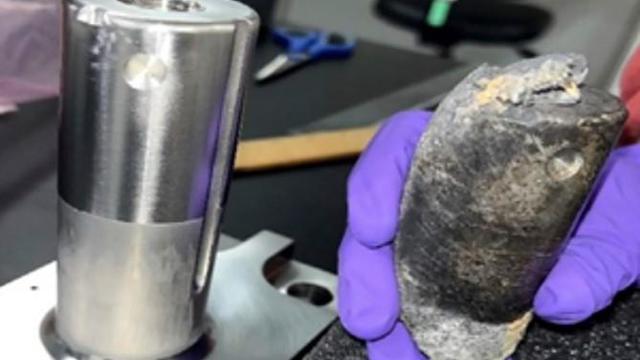
NASA confirmed Monday that a mystery object that crashed through the roof of a Naples, Florida home last month was space junk from equipment discarded by the space station.
NASA said it agrees with an independent review board that concluded the project could cost up to $11 billion without major changes.

It was a "bittersweet moment" as United Launch Alliance brought the Delta program to a close.

NASA flight engineers managed to photograph and videotape the moon's shadow on Earth about 260 miles below them.

Millions of Americans poured into the solar eclipse’s path of totality to watch in wonder. The excitement was shared across generations for the rare celestial event that saw watch parties across the country as almost all of the continental U.S. saw at least a partial solar eclipse.
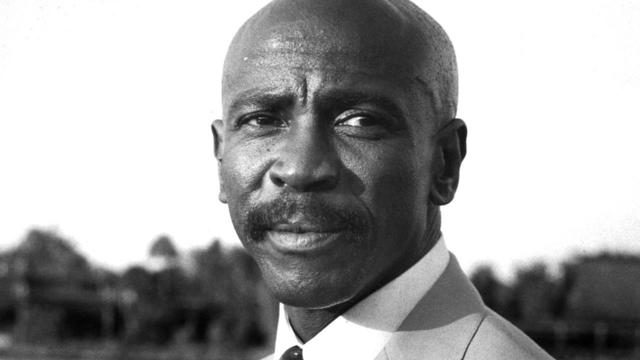
A look back at the esteemed personalities who've left us this year, who'd touched us with their innovation, creativity and humanity.

The Francis Scott Key Bridge in Baltimore collapsed early Tuesday, March 26 after a column was struck by a container ship that reportedly lost power, sending vehicles and people into the Patapsco River.
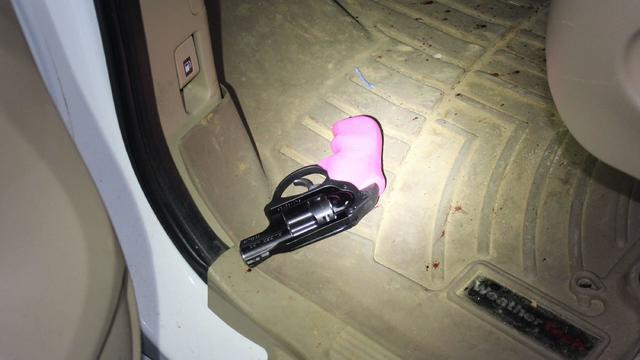
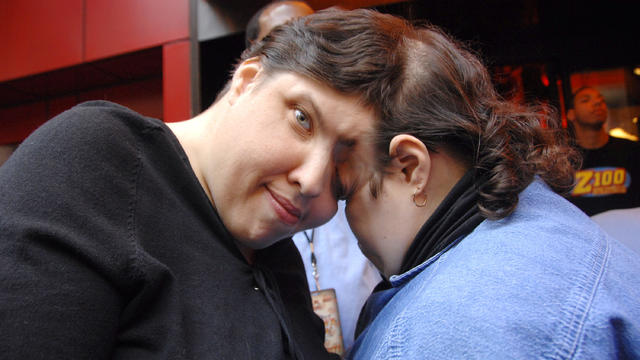
When Tiffiney Crawford was found dead inside her van, authorities believed she might have taken her own life. But could she shoot herself twice in the head with her non-dominant hand?
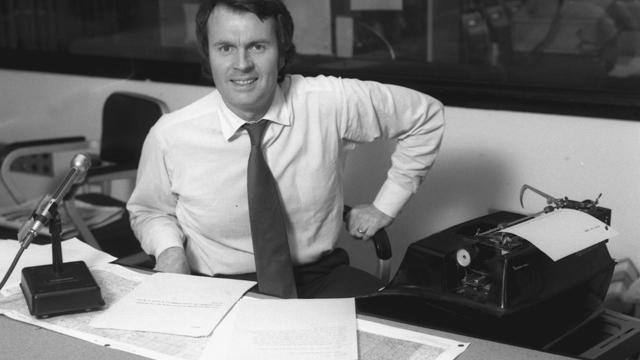
We look back at the life and career of the longtime host of "Sunday Morning," and "one of the most enduring and most endearing" people in broadcasting.

Cayley Mandadi's mother and stepfather go to extreme lengths to prove her death was no accident.

"This is our Notre Dame": Copenhagen's Old Stock Exchange building, which dates back to the 17th century, erupted into flames in what onlookers could only describe as a tragedy. The iconic building's dragon-tail spire, which legend says protected it from nearby fires for years, collapsed.

Jury selection resumes Tuesday morning in Donald Trump's "hush money" case. Trump faces 34 felony counts for allegedly falsifying business records in order to hide an alleged affair with former adult film star Stormy Daniels, charges he denies. Those in the courtroom Monday say Trump appeared irritated and bored at times. CBS News chief election and campaign correspondent Robert Costa has more.

On this edition of CBS Mornings Deals, Elizabeth Werner shows us items that might just become essentials in your everyday life. Visit cbsdeals.com to take advantage of these exclusive deals today. CBS earns commissions on purchases made through cbsdeals.com.
Recognized as one of CMT's "Next Women of Country," Tanner Adell's career soared after her appearances on Beyoncé's latest album. With a 1,500% spike in Spotify listeners and a new single, "Whiskey Blues," Adell is quickly becoming a standout in the country-pop scene.
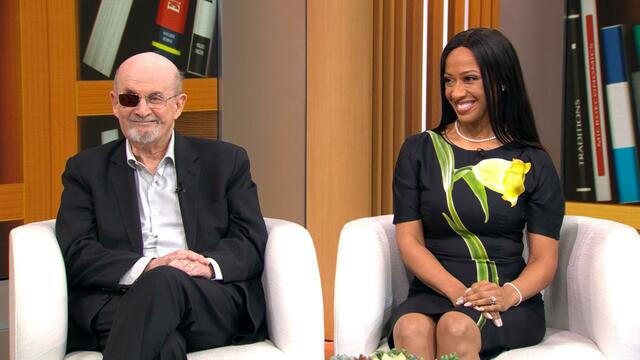
Award-winning author Salman Rushdie describes his new memoir as a "reckoning." In 2022, he was stabbed in the neck and abdomen more than a dozen times in western New York and lost sight in his right eye. In Rushdie's new memoir, "Knife: Meditations After an Attempted Murder," he writes about the attack. He and his wife, poet and author Rachel Eliza Griffiths, join "CBS Mornings" for their first joint live interview.